“Just Keep Swimming:” Movements of Female Olive Ridley and Hawksbill Sea Turtles
The original goal of this project was to map the movement of sea turtles.
I was inspired by an article that I read a few years ago in Nautilus magazine, Where the Wild Things Go. Oliver Uberti wrote the article and also created the gorgeous illustrated maps of elephant and sea turtle migration data. “To protect animals you need to protect where they go,” said Archie Carr, one of the pioneer sea turtle trackers, when asked about the reason for tracking wild animals. The ocean has a number of Marine Protected Areas (MPAs) to protect habitats and migration routes from fishing and shipping routes. Sea turtle tracking supports animal welfare by showing scientists the amount of ocean area that needs to be protected to save these species from extinction. In the article, Uberti highlights the Marine Turtle Research Group at the University of Exeter and their project, seaturtle.org, to track loggerhead sea turtles. The resulting maps created from seaturtle data, are visually stunning and easy to read, I’ve thought about these maps multiple times since the article came out.
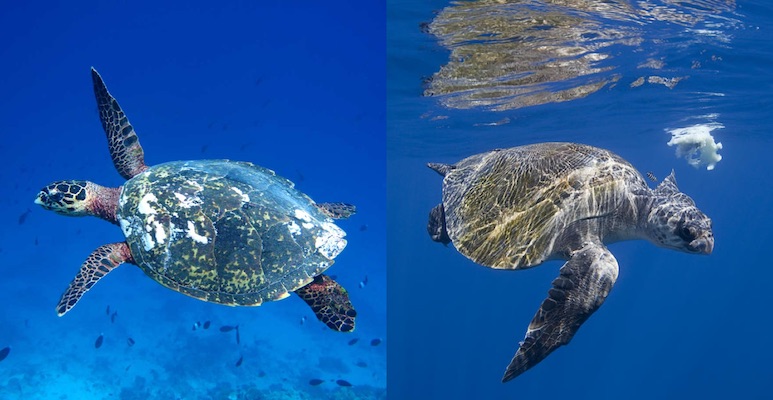
For my map, I chose to use data from the Global Biodiversity Information Facility (GBIF), because it was more straightforward and easier to work with. Even though the data is from 2005 and 2009-11 and is already plotted on maps on the website, I wanted to see if I could successfully map data as well. Olive Ridley (Lepidochelys olivacea) are the second smallest sea turtle species at about 2.5 feet. Hawksbill turtles (Eretmochelys imbricata) have the most vibrant shells and are what most people picture when they think of sea turtles. Both are found in Australia, and the movement of nesting females is the data that I used. The Olive Ridley population has been nearly cut in half since 1960 and the Hawksbill population has decreased by over 80 percent in the last century.
I’ve been fascinated with sea turtles since I witnessed Loggerheads nesting and hatching in Trinidad. I’m curious about Geographic Information Systems, and am trying to figure out how to translate a LIS degree to a job at a zoo, aquarium, or marine biology research station.
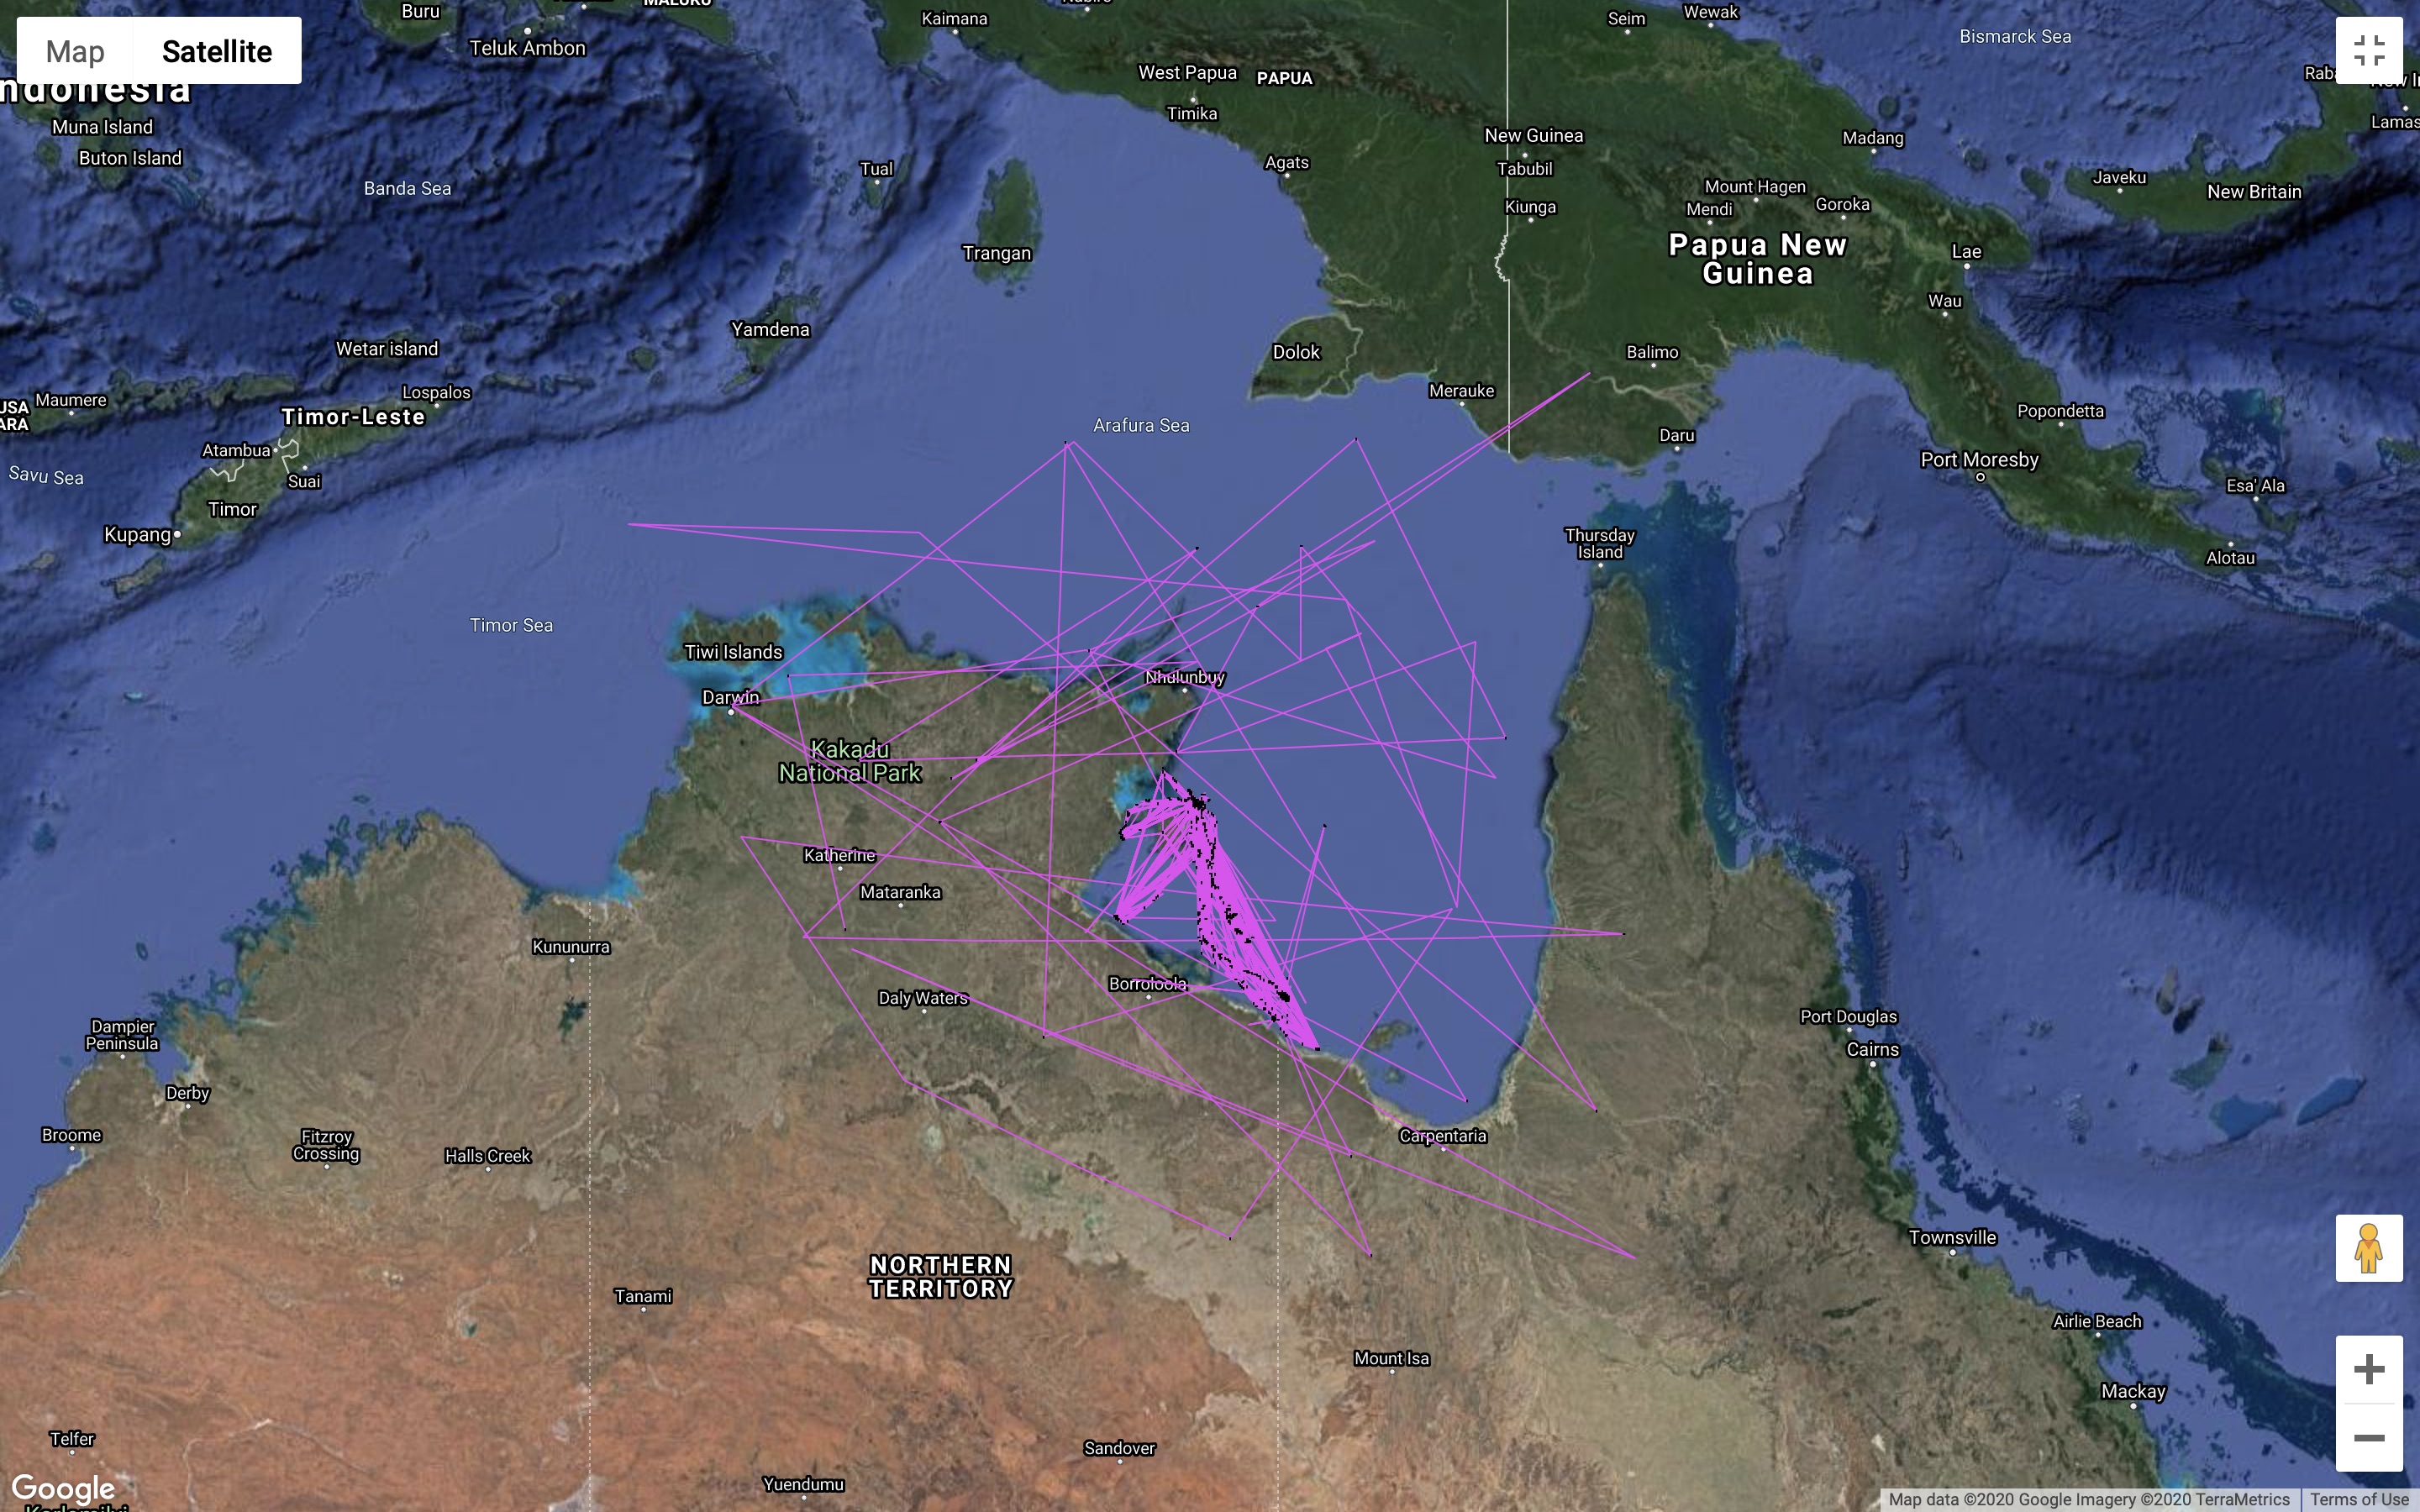
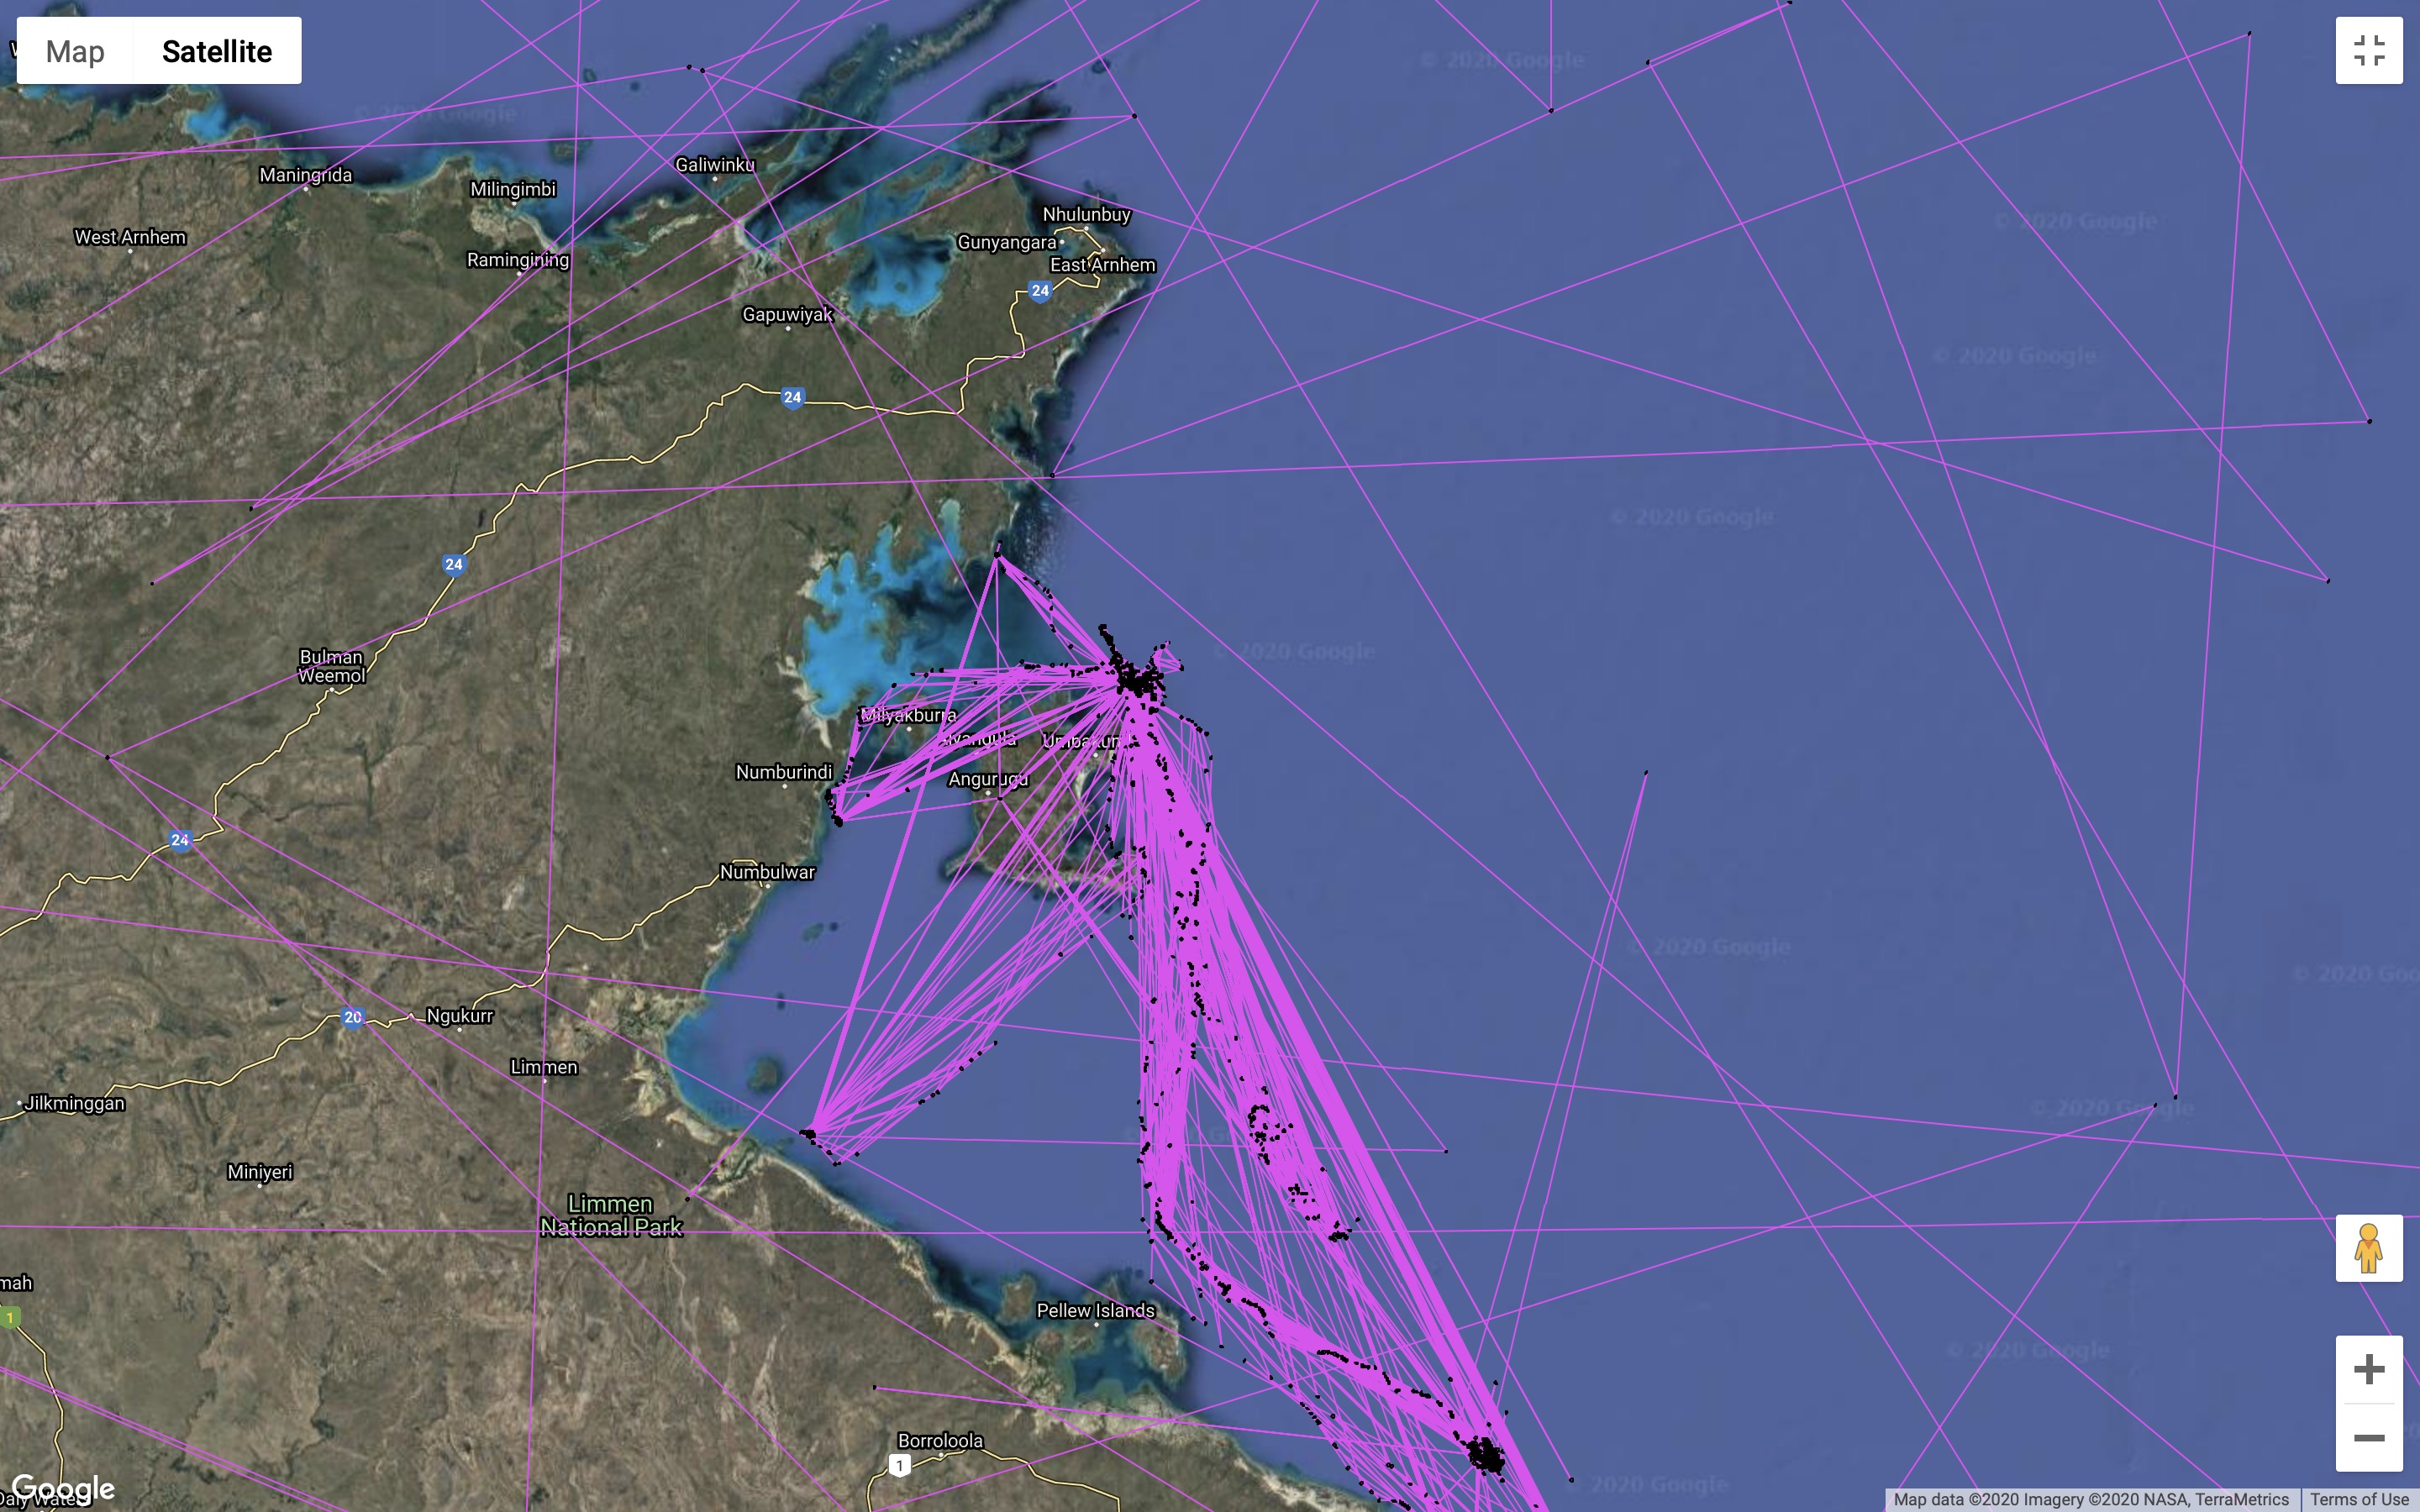
Hawksbill Sea Turtle paths
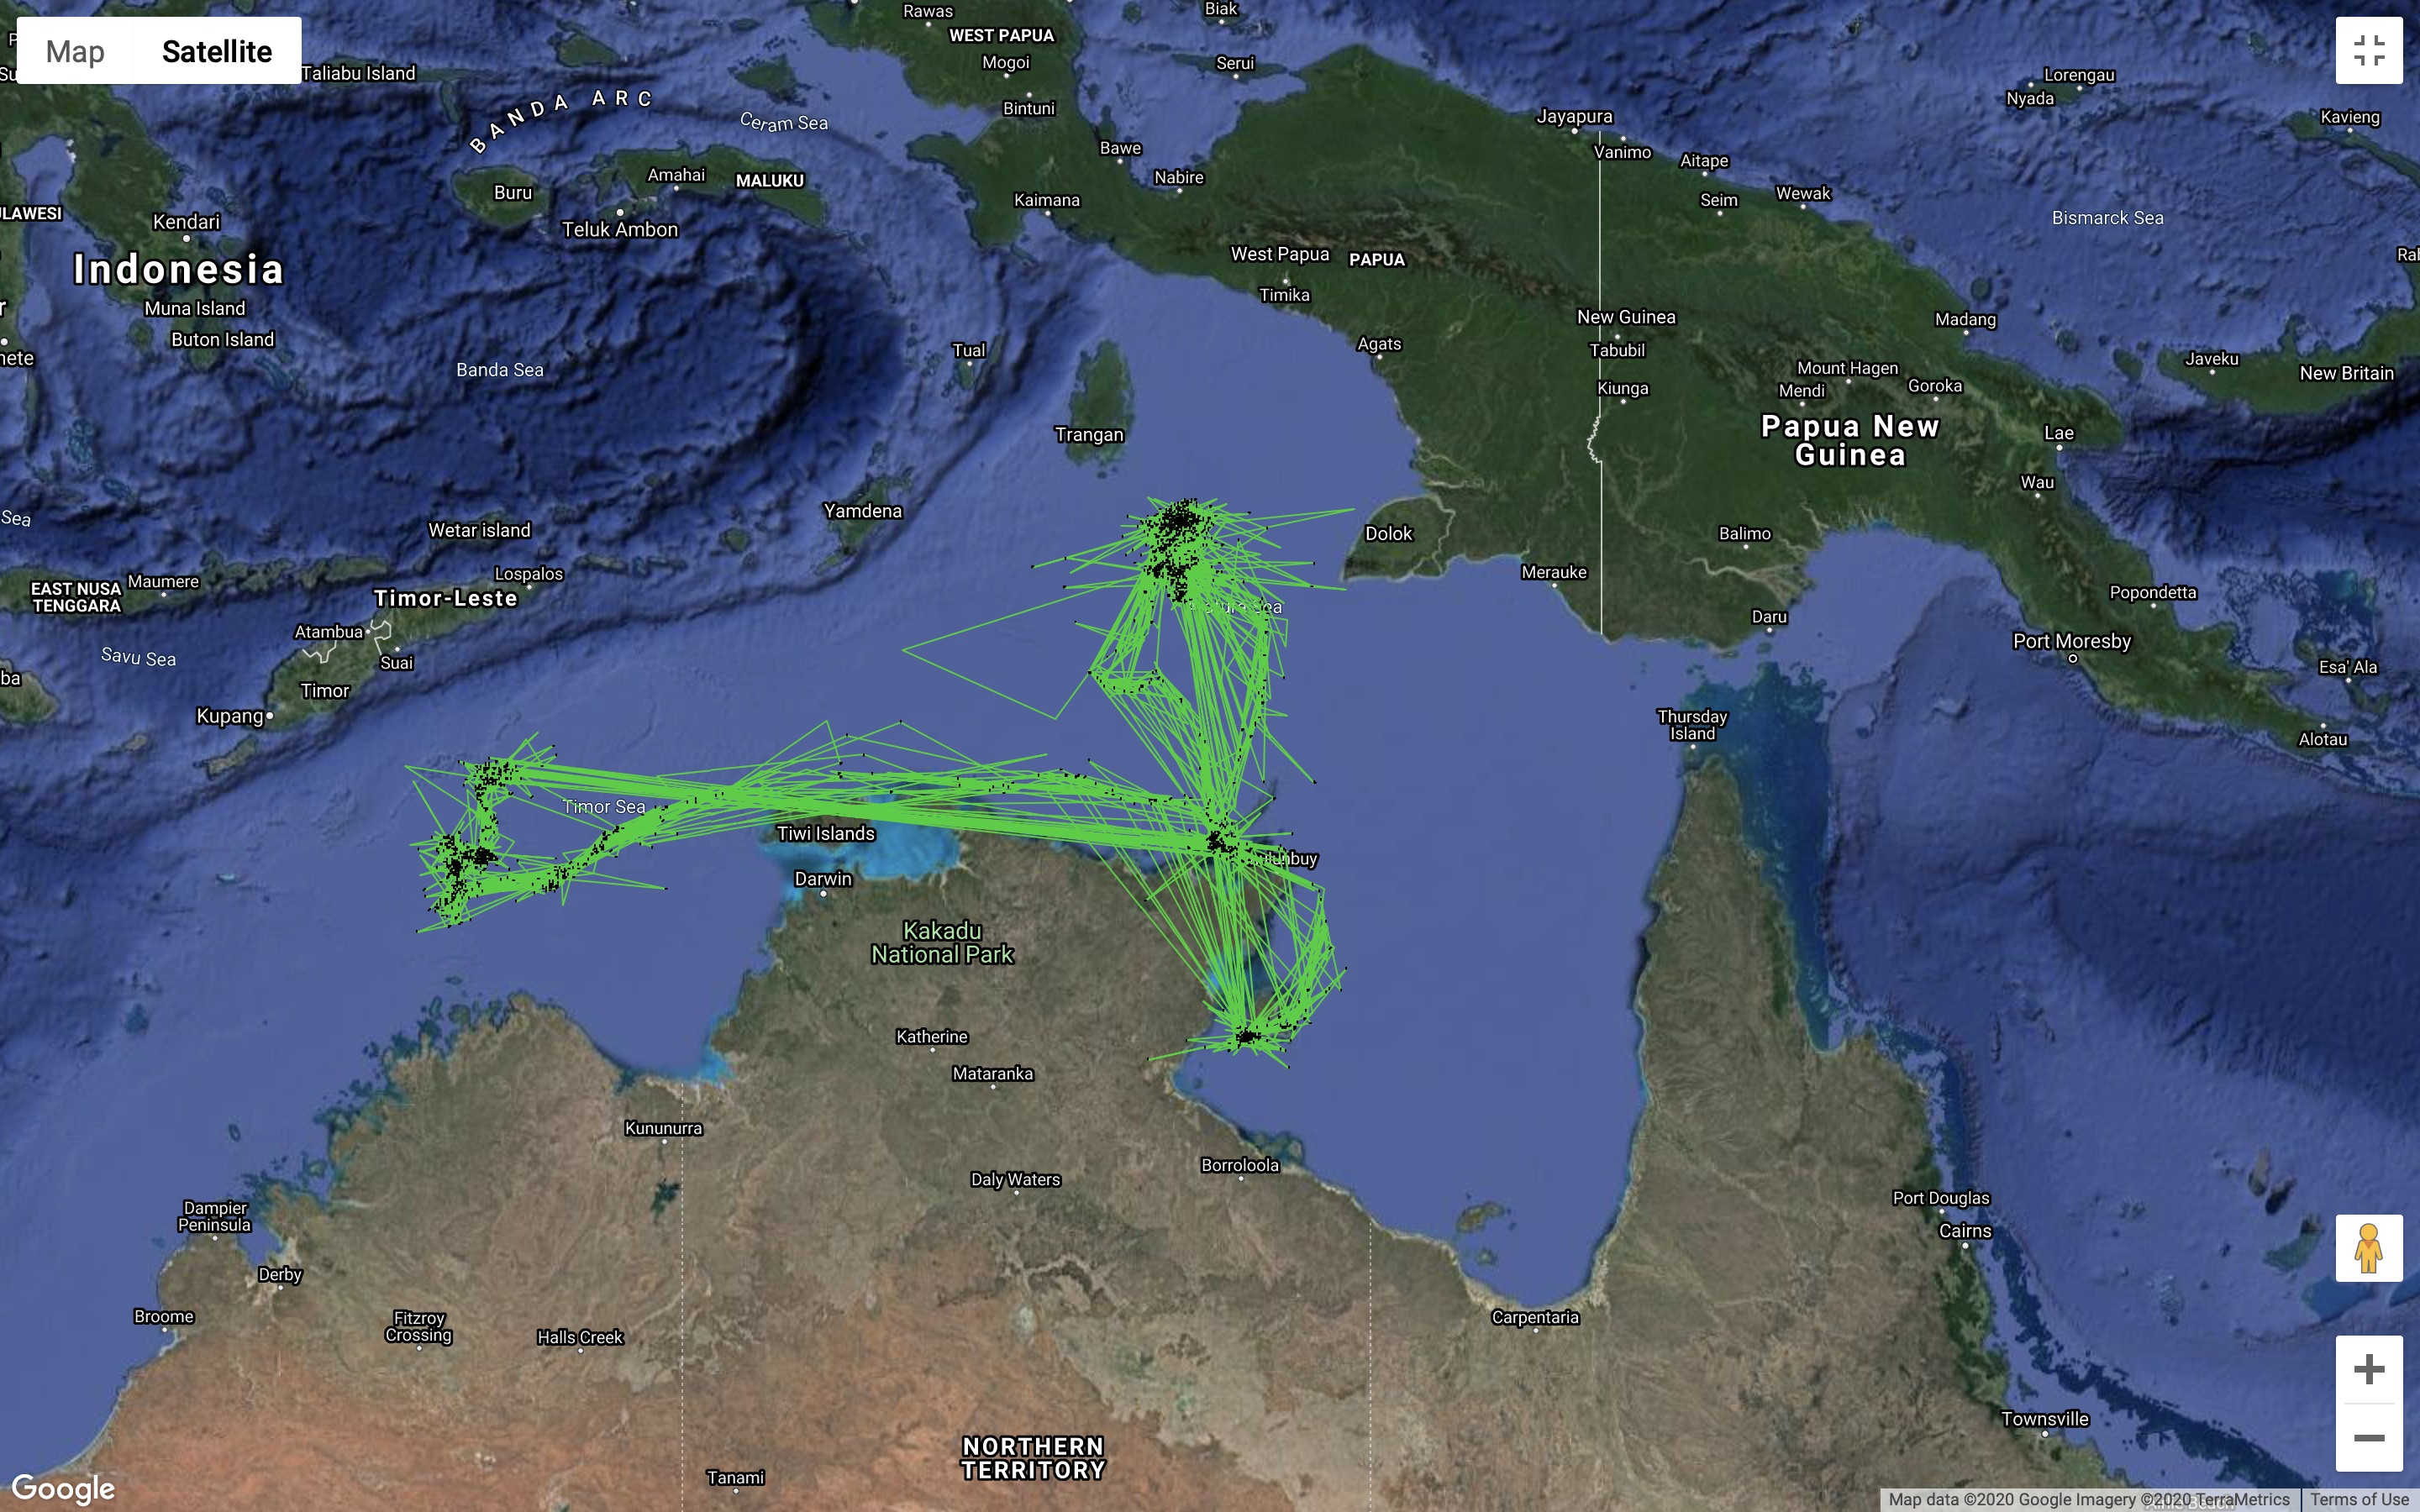
Olive Ridley Sea Turtle paths
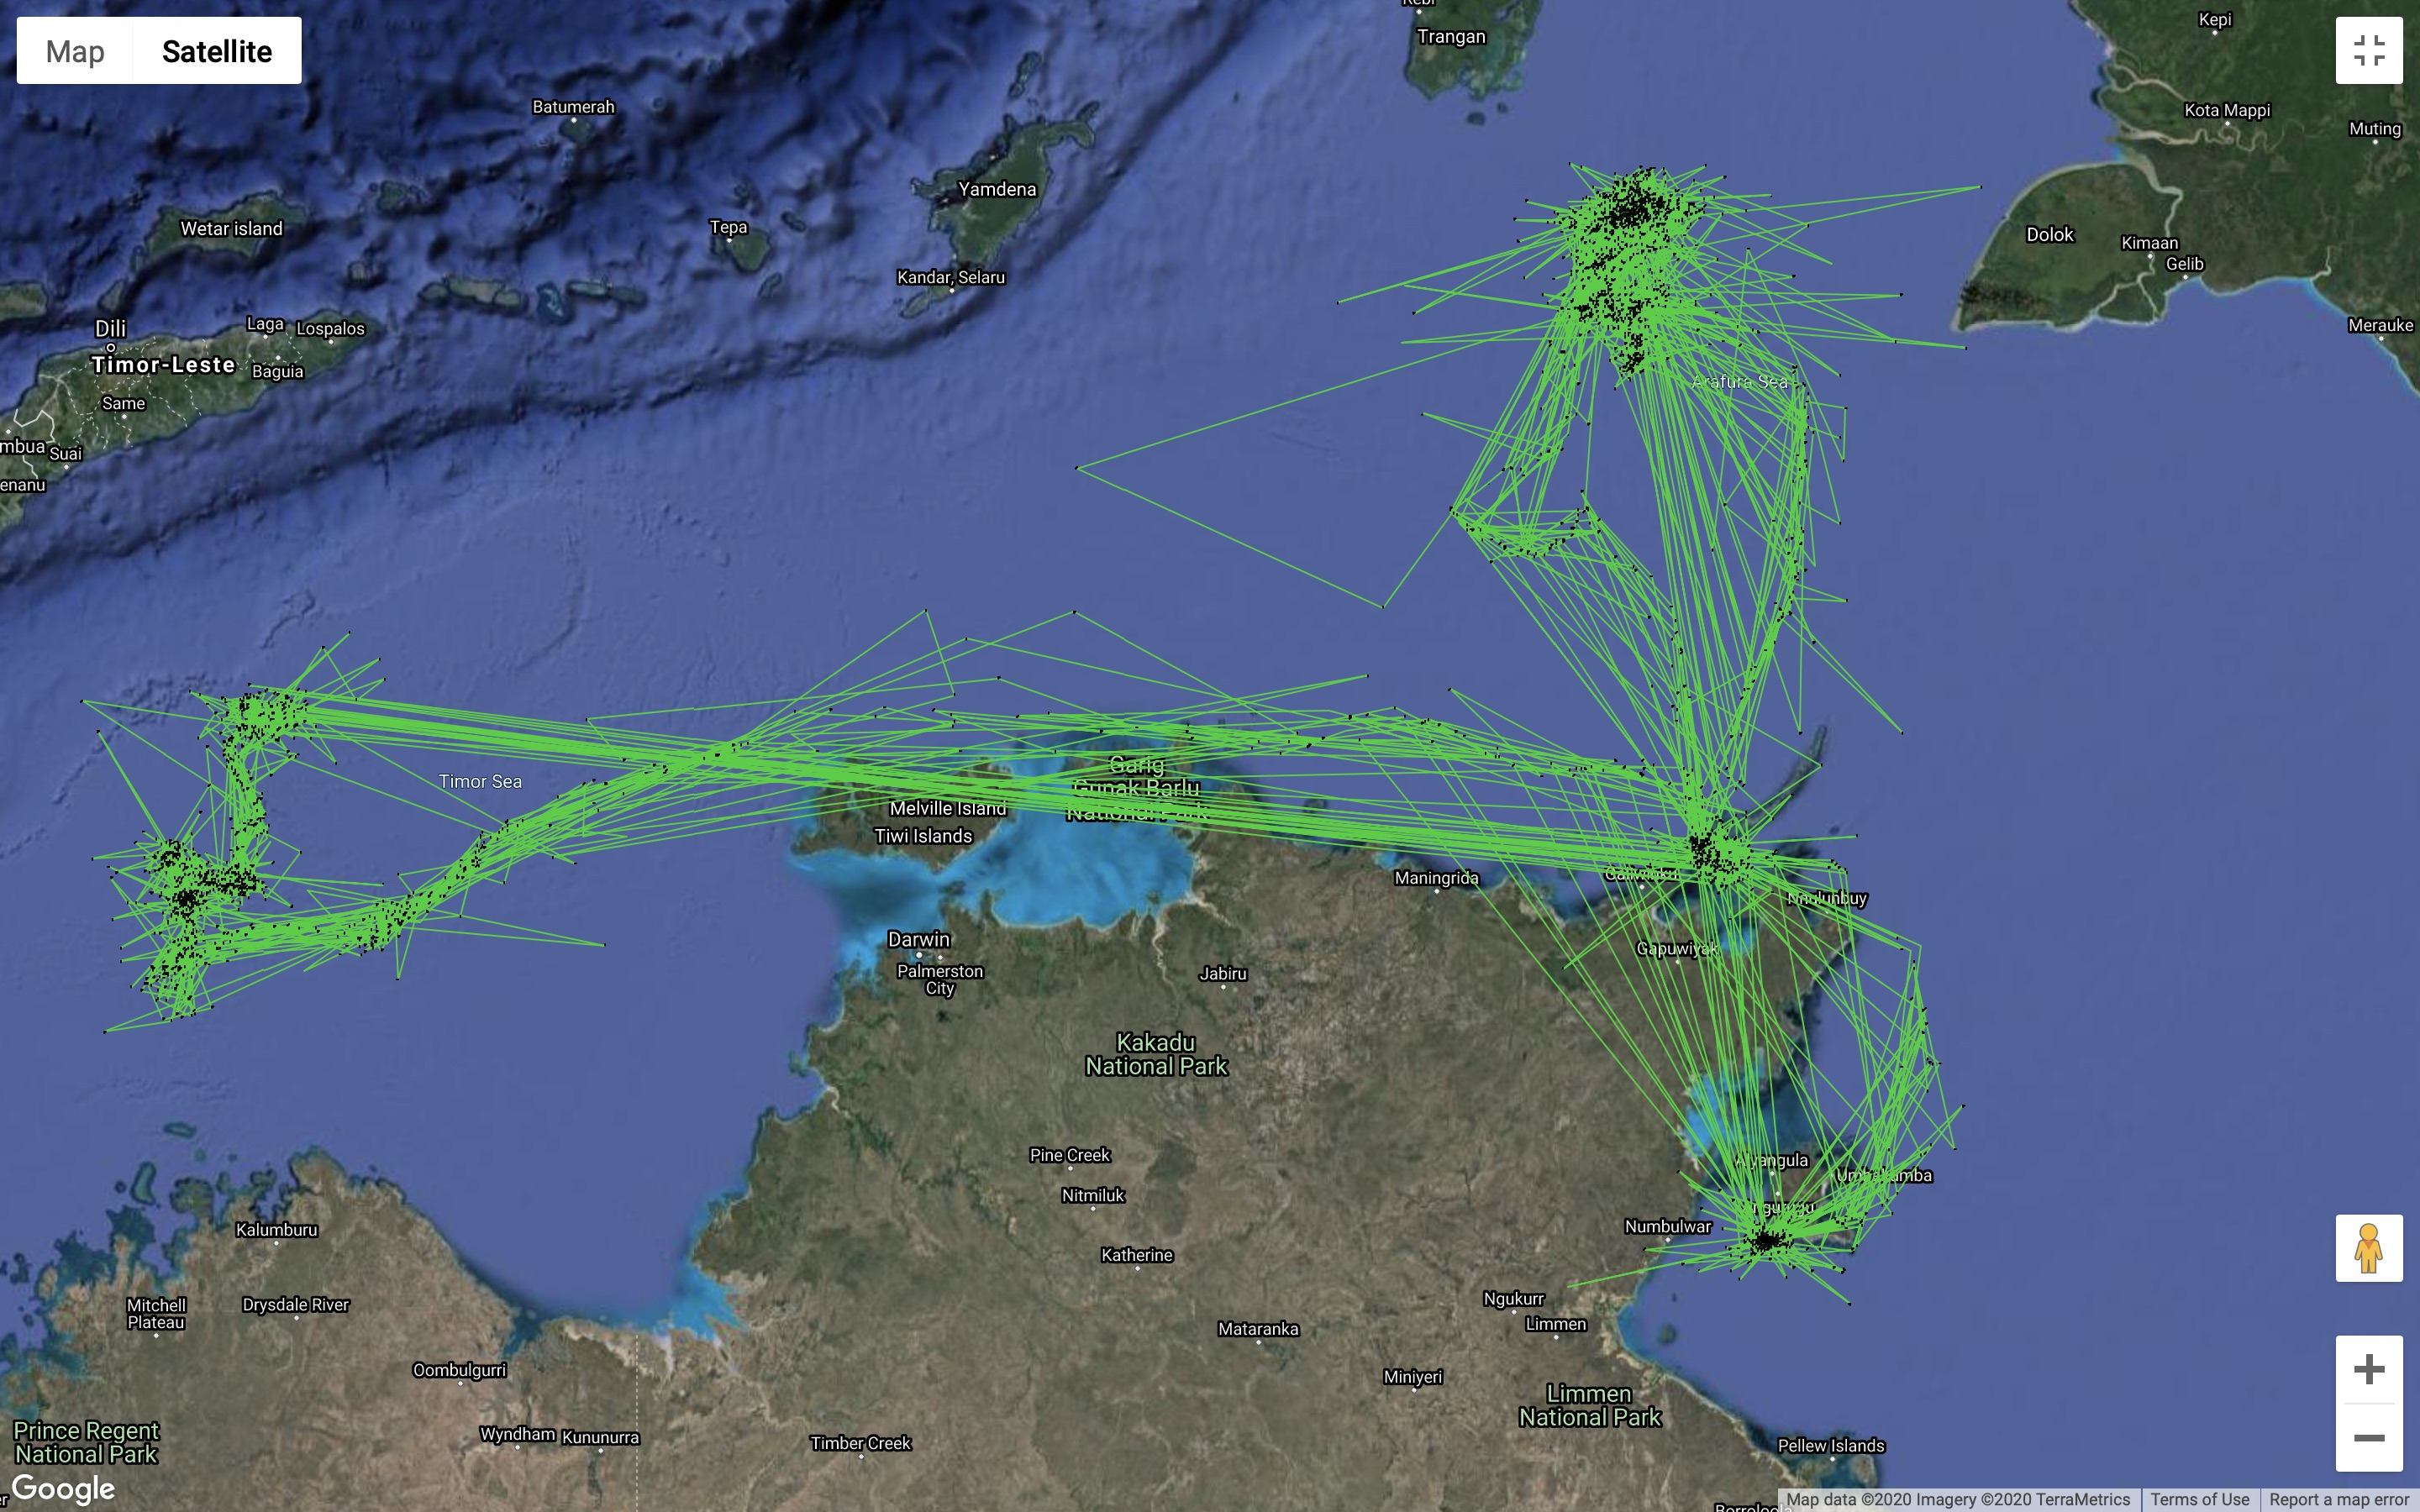
Data source:
Data was sourced from the Integrated Marine Observing System (IMOS) - IMOS is supported by the Australian Government through the National Collaborative Research Infrastructure Strategy and the Super Science Initiative.
Satellite tracking of female olive ridley sea turtles (Lepidochelys olivacea) nesting in the Wessel Islands,
Northern Territory, 2005
GBIF.org (5 April 2020) GBIF Occurrence Download https://doi.org/10.15468/dl.no7th6
Satellite tagging of female hawksbill sea turtles (Eretmochelys imbricata) nesting on Groote Eylandt,
Northern Territory, 2009-2011
GBIF.org (20 April 2020) GBIF Occurrence Download https://doi.org/10.15468/dl.gnpapz
Further Resources:
Sea turtle species tracked at seaturtle.org: Hawksbill,
Loggerhead, Green Turtle, Olive Ridley, Kemp’s Ridley, and Flatback.
Uberti also wrote a book with James Cheshire, which further details and explores technologies used to track
animal migrations: Cheshire, James & Uberti, Oliver. (2017). Where the animals go: Tracking wildlife
with technology in 50 maps and graphics. W. W. Norton & Company.
Walking through the code:
As is often the case, hours of work ended up being only about 30 lines of code.
I was working with data that I used for a regular expression challenge and I extracted the latitude and longitude coordinates with a regular expression. Separately, I found a tutorial online for gmap - the google maps API. Figuring out how to request a google maps API was frustrating until I found the right webpage that walked me through it step by step. This tutorial, which also took me a long time to find, also showed how to use the gmplot - a module for google maps - to plot coordinates onto a google map. The test worked, then I hardcoded 8 coordinates into the list and it worked, but I hit a wall when I needed to put my 3000+ coordinates into the gmap and gmplot code as a list.
Eventually, I realized that the data I was working with was a TSV instead of a CSV. I opened it with Numbers and converted it to a CSV. I then used Pandas - another module - to manipulate the CSV data into a list. With the help of google and other tutorials, I figured out the code to extract the latitude column and the longitude column as lists and put them into my gmplot code. From that point it was just a matter of playing around with the appearance of the lines and points.
Top of page photo sources:
- (left image) Aguadormi, identified hawksbill turtle, Maldives © Chiara Fumagalli
- (right image) Olive Ridley turtle, worldwildlife.org